

How to Build a Live Dashboard with Claude Dashboards
Build a live dashboard with Claude Dashboards: connect BigQuery or Salesforce, review queries, refresh charts, and share results.
A live chart used to mean a ticket to the data team or a half-written SQL query. On October 8, 2026, Anthropic put that job inside Claude. Claude Dashboards, now in beta on paid plans, connects to a warehouse or CRM and builds charts that stay current as the data changes.
This guide walks through who can use it, how to ask for a first dashboard, and how to check the query behind every number before you share it.
What Claude Dashboards actually does
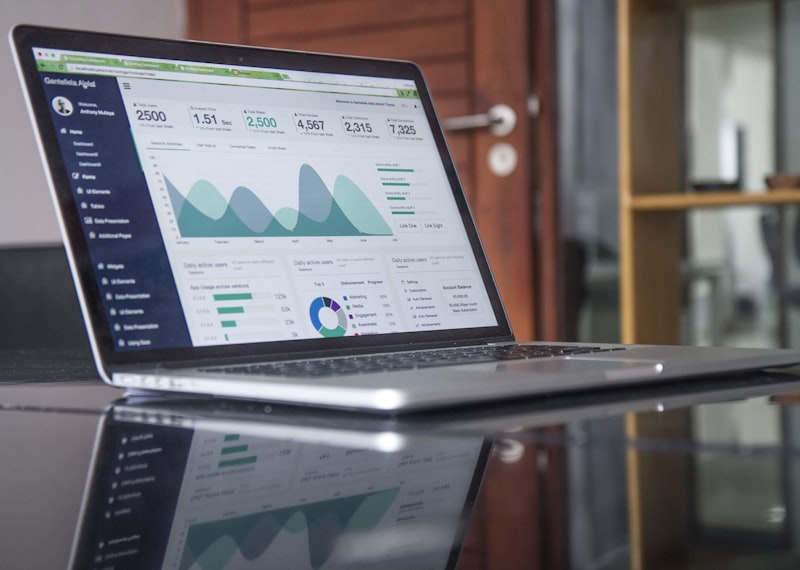
Claude Dashboards is an artifact type, not a separate analytics product. You describe the question in plain language. Claude pulls from a connected data platform, lays out the charts, and keeps them current as the source data changes.
Anthropic lists Amazon Redshift, BigQuery, ClickHouse, Databricks, and Snowflake as warehouse connectors. Salesforce is the CRM example in the launch note. Other connectors you already use in Claude can feed a dashboard too.
Each chart shows the query behind it and when the data was last refreshed. Click a number to inspect that query, or ask Claude to explain it. That audit trail is the reason this is usable for exploratory work, not only for a slide.
Dashboards sit next to existing BI tools. If a question needs a deeper cut, you can send the dashboard from Claude to Amplitude, Grafana, Hex, Mixpanel, Omni, Perplexity, PostHog, or Sigma. Looker, monday.com, and Tableau are listed as coming soon.
Who can turn it on
Claude Dashboards is in beta on paid plans. Claude Motion, the companion animation tool, is in beta on Team and Enterprise only. Docs, Slides, and Design left beta the same day and are available on every plan, including Free.
Enterprise admins do not get Dashboards or Motion by default. Turn them on under Organization settings, then Artifacts. Docs, Slides, and Design turn on by default on October 15, 2026, or an admin can enable them earlier.
If your workspace still hides Artifacts, the prompt will not produce a live dashboard. Confirm the setting before you write the first question.
Connect a data source
Claude cannot invent rows from a warehouse it cannot see. Connect the source first.
- Open Claude on the web and sign in with a paid plan.
- Open the connectors or integrations panel for your account or organization.
- Add the warehouse or CRM you actually use. BigQuery, Databricks, Snowflake, Redshift, ClickHouse, and Salesforce are the sources named in the October 8 announcement.
- Complete the provider sign-in. Use a role that can read the tables you care about, not a write-all admin key.
- Confirm the connector shows as available in the chat before you ask for charts.
If the connector is missing, stop. A dashboard built from a pasted CSV is a snapshot, not a live view. Paste a file only when you want a one-off check.
Ask for the first dashboard
Anthropic’s own starter prompt is direct: “Build a dashboard of this quarter’s revenue by region.” That shape works. Name the metric, the split, and the time window.
Useful first prompts:
- Build a dashboard of this week’s signups compared with last month, split by plan.
- Show Salesforce opportunities created this quarter by stage and owner.
- Chart failed checkouts by country for the last 14 days, and list the top three error codes.
Keep the first request narrow. One metric family is easier to audit than a full executive pack. After the artifact opens, ask for one change at a time: drop a chart, change the date grain, or rename a series.
Claude makes the first version. You decide what gets shared.
Read the query before you trust the number
A chart without a query is a guess. In Claude Dashboards, click any number to see the query behind it. Read three things:
- The table or object name matches the source you intended.
- The date filter matches the window you asked for.
- Aggregations are not double-counting, especially on opportunity or order tables with line items.
Ask Claude to explain a chart in plain language if the SQL is dense. Then check the refresh timestamp on that chart. A dashboard that last refreshed yesterday is not a live view of this morning’s pipeline.
If the query is wrong, say what is wrong. “Exclude test accounts where email ends in example.com” is a better follow-up than “fix the chart.”

Share, export, or hand off
Team members and Claude can work on the same dashboard. You can share dashboards outside the organization, or with anyone who has the link, if an admin allows it.
For a deeper cut, send the dashboard to one of the supported analytics tools listed above and continue there. Do not treat the Claude artifact as the system of record for a board pack until someone has checked the queries.
Artifacts on Enterprise can use customer-managed encryption keys, and admins choose which artifact templates the organization uses. That control matters if the dashboard includes revenue or customer fields.
Turn a chart into a short explainer with Claude Motion
Claude Motion is separate and narrower. It is in beta on Team and Enterprise. You ask Claude to animate a report, a chart, or a product walkthrough. It writes code that moves your text, charts, shapes, and images. It does not use a video generation model, so there is no generated footage and no AI-generated people.
You can edit any word, number, or timing in the editor, or ask Claude to change it, then download an MP4. Anthropic’s example prompts include a 30-second all-hands explainer from a quarterly report and a pricing comparison for a sales kickoff.
If you need a full edit bay, open the result in Adobe, Descript, HeyGen, Higgsfield, invideo, Luma AI, or Runway. Canva and Captions are listed as coming soon.
Enterprise admins enable Motion in the same Artifacts setting as Dashboards.
Docs, Slides, and Design on every plan
The same October 8 update took Docs, Slides, and Design out of beta. Anthropic says people have made more than 45 million docs, decks, and designs in Claude since those tools landed in every conversation.
Practical changes that ship with the general release:
- PowerPoint and PDF downloads keep the formatting you see in the editor.
- Decks can go to Google Slides as editable files.
- You can edit a doc, deck, or design in the Claude mobile app.
- Sharing outside the team follows the same admin rules as dashboards.
If your team already drafts in Google files, the Workspace add-on and Docs, Sheets, and Slides connectors are a separate path. The setup steps are in how to connect Claude to Google Docs, Sheets, and Slides.
Move design systems before December 14
Claude Design started at claude.ai/design. Since September 16, 2026, Design also runs inside every Claude conversation, where it can use chat context, files, and connectors. Anthropic is folding the standalone site into Claude. The old URL stays up until December 14, 2026.
On the Artifacts page, use Migrate team design systems. One migration brings over every design system in the organization. Originals stay unchanged on the standalone site until it closes. Projects keep working there until that date. Chats and comments on standalone projects are not copied, and public links to those projects stop working when the site closes.
Tips that keep the first dashboard honest
- Start with a question you can check in the source tool in under a minute.
- Prefer a read-only connector role.
- Ask for the comparison window in the first prompt so the query does not default to all time.
- Refresh, then read the timestamp, before you paste a chart into a deck.
- Hand off to Hex, Sigma, or your warehouse BI tool when the question stops being exploratory.
- On Team and Enterprise, turn Motion on only if someone will review the MP4 before it leaves the company.
Conclusion
Claude Dashboards is a beta way to ask a warehouse or CRM a narrow question and get charts with the query attached. Paid plans can try it once a connector is live. Enterprise workspaces need an admin to enable Artifacts first. Treat the first dashboard as a draft, click through the queries, and share only after the numbers match the source.
Sources
- Anthropic, “Build live dashboards and animate explainers with Claude,” October 8, 2026: https://claude.com/resources/articles/dashboards-and-motion
- Claude YouTube, “Introducing Claude Dashboards and Claude Motion,” October 8, 2026: https://www.youtube.com/watch?v=en0GuyhieQk
Share this story


