

How Researchers Set Up Google Earth AI Health Models
Request Population Dynamics Insights, subscribe in BigQuery, and join Google Earth AI embeddings to local case data for outbreak forecasts.
Public health teams still wait years for some official county mortality files, then build a new feature pipeline for every outbreak. On 6 October 2026, Google Research described a different path: plug location embeddings from Google Earth AI into the statistical models teams already run.
The commercial path is Population Dynamics Insights (PDI), a Preview dataset on Google Maps Platform. It is powered by the Population Dynamics Foundation Model (PDFM). The agent demos used in the Democratic Republic of the Congo are research prototypes, not a self-serve product. This guide covers what you can set up today, what stays partner-only, and how to join embeddings to local case tables without inventing a new surveillance system.
What Google published on 6 October
Google Research and Google Health said Earth AI pairs environmental signals, satellite imagery, mobility data, AlphaEarth Foundations, and PDFM with a prototype Geospatial Reasoning agent. Partners received two research prototypes: the agent for conversational spatial mapping, and a planetary prediction engine for autonomous disease forecasting.
During the Ebola outbreak in the Democratic Republic of the Congo, the World Health Organization Regional Office for Africa (WHO AFRO) used the agent prototype to map remote mining corridors. Google says the team pinpointed 48 exposed settlements and more than 45,500 at-risk people in minutes, a process that would normally take weeks. Separate models with the Epidemic Modeling and Intelligence Unit at the National Institute of Biomedical Research (INRB) estimate spread into uninfected zones from mobility flows, historical cases, and Earth AI datasets.
Those agent sessions are not something you turn on in the Gemini app. PDFM embeddings are the part researchers and companies can request.

What the embeddings actually contain
PDFM compresses privacy-preserving signals into a fingerprint for a place, refreshed monthly. Google Research lists three groups:
- Aggregated search trends for topics that drew community-level interest.
- Built environment and mobility, such as density and busyness of pharmacies, clinics, and parks.
- Environmental determinants, including weather and air quality statistics.
Maps Platform describes PDI as 330-dimensional embeddings indexed at S2 cell level 12, about 3 to 6 square kilometres. You do not receive raw search queries or individual trips. You receive vectors meant to drop into an existing model as extra columns.
Country listings currently cover Australia, Belgium, Brazil, Canada, France, Germany, India, Italy, Japan, Mexico, the Netherlands, Nigeria, Portugal, Spain, Switzerland, the United Kingdom, and the United States. Each country is its own Analytics Hub listing.
What the partner studies measured
The 6 October research post reports five evaluations. Read the numbers as study results, not as a guarantee for your next season.
Cardiovascular mortality nowcasting across 3,091 contiguous U.S. counties was comparable to census-based models. Mean absolute error was 18.7 deaths per county with PDFM versus 19.1 with conventional covariates. Differences were not statistically significant. The practical point is lag: National Vital Statistics System county files often trail by one to two years, and American Community Survey covariates can reflect conditions two to three years old.
MMR vaccination models for 146 U.S. counties within 150 km of Canada explained more variance after Canadian area embeddings were added: 0.159 to 0.216, a 36 percent relative gain. Coverage estimates shifted by at least 3 percentage points for 4.7 million border residents.
Dengue forecasts across about 2,450 Mexican municipalities improved on a one-month horizon when PDFM was combined with TimesFM. Accuracy improved in up to 72 percent of municipalities with active transmission. Cholera onset models in 403 DRC health zones over 89 weeks gained 9.7 percent relative area under the precision-recall curve at four weeks, and 18.1 percent Precision@5 at eight weeks.
Postpartum depression risk on CDC PRAMS data (332,970 respondents) saw small AUC gains: plus 0.0020 in seen states on a 0.62 baseline, and plus 0.0038 in unseen states. Embeddings recovered about 15 percent of the predictive signal of income and insurance records. Small lifts still matter when the alternative is waiting on a survey wave.
None of this replaces clinical judgment or official case definitions. If you already follow CDC FluSight ensemble forecasts, treat Earth AI the same way: a model input, not a dispatch order.
Request access before you query anything
PDI is Preview (pre-GA). Support is limited, and the schema can change. Commercial access starts at the Maps Platform geospatial analytics signup. Academic and public-health researchers can also request no-cost access for select, non-operational research use cases through the form linked from the 6 October blog post. Eligible nonprofits can apply for Google Earth credits under Maps Platform Public Programs.
Do not assume a personal Gmail account can subscribe. Onboarding is an approval step.
Set up BigQuery after you are approved
Google’s setup guide lists these prerequisites once access is granted:
- Keep a Google Cloud project with billing enabled if your use is commercial. Research no-cost access still needs a project.
- Enable the BigQuery API.
- Enable the Analytics Hub API.
- Grant your user
roles/analyticshub.subscriptionOwnerso you can subscribe to a listing. - Grant
roles/bigquery.userso you can create a dataset that holds the linked table. - Subscribe to the country listing you need. A U.S. subscription does not include Mexico or India.
After the subscription appears, open the linked dataset in BigQuery and confirm the embedding column width before you join. Maps Platform documents 330 dimensions. If a later refresh changes that, your feature pipeline should fail closed instead of silently truncating.
Official Colab notebooks on the Population Dynamics Insights docs page show sample joins. Start there rather than hand-writing a geometry library.
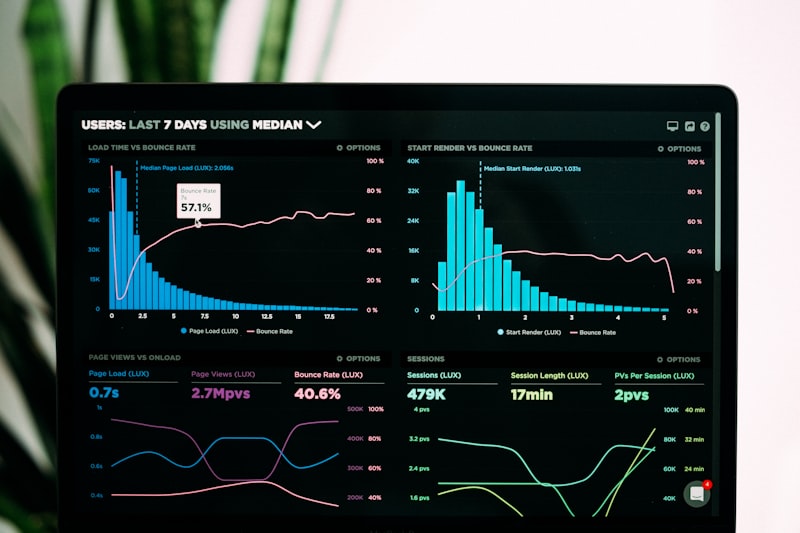
Join embeddings to a health table
A workable first experiment has four steps.
- Pick one outcome you already model: weekly cases, clinic visits, or a mortality rate. Keep the official definition.
- Map each row to an S2 cell at level 12, or to the admin unit your study uses, then aggregate cells up. Document the crosswalk.
- Join the matching month of embeddings. PDFM refreshes monthly, so a weekly case file should not use a future month.
- Train the same model twice: baseline covariates only, then baseline plus embeddings. Report the metric your field already trusts (WIS, AUC, MAE), plus a confidence interval.
Google’s dengue work combined embeddings with TimesFM. You do not have to. A regularized regression or gradient-boosted tree is enough to test whether the vectors add signal.
Hold out a later time period, not a random row split. Outbreak labels leak across neighbouring cells in the same week.
Watch the Geospatial Reasoning demo, then separate it from PDI
The agent that mapped mining corridors is a research prototype. The public demonstration from Google Research shows the same pattern on a hurricane scenario: the agent calls foundation models, fills a missing geography with population embeddings, and returns a map. Use it to brief a team on the idea. Do not cite the demo as evidence that your Cloud project can run the DRC workflow.
Tips before you brief a health director
- Say Preview out loud. Pre-GA terms on Maps Platform allow breaking changes.
- Name the country listing. A model trained on U.S. cells is not validated for a country without a listing.
- Keep a human review on any zone ranked for deployment. The DRC cholera gain was Precision@5, not a perfect early-warning alarm.
- Do not paste patient-level records into a prompt. Embeddings are aggregated. Your case file may not be.
- Log the embedding month next to the model version. A monthly refresh can move scores without a code change.
- Pair forecasts with the same baseline you already beat. FluSight-style skill against “same as last week” is easier to defend than a single accuracy percentage.
Conclusion
Google Earth AI’s 6 October update is two products in one announcement. Partner teams can test agent prototypes on live emergencies. Everyone else starts with Population Dynamics Insights: request access, subscribe to a country listing in Analytics Hub, and join monthly embeddings to a table you already trust.
The useful test is narrow. If embeddings match census covariates on a lagged outcome, you have a stand-in for the years official files are late. If they do not beat your baseline on a future holdout, stop. The papers are public. Your local case definition still decides whether the map is ready for operations.
Sources
- Google Blog, “Making global public health more proactive with Google Earth AI,” 6 October 2026: https://blog.google/innovation-and-ai/technology/health/google-earth-ai/
- Google Research, “Unlocking Earth AI’s planetary geospatial foundation models for global public health,” 6 October 2026: https://research.google/blog/earth-ais-planetary-geospatial-foundation-models-for-global-public-health/
- Google Maps Platform, “Set up Population Dynamics Insights”: https://developers.google.com/maps/documentation/population-dynamics-insights/cloud-setup
- Google Maps Platform, “From Static Maps to Geospatial AI: Announcing Population Dynamics Insights”: https://mapsplatform.google.com/resources/blog/from-static-maps-to-geospatial-ai-announcing-population-dynamics-insights/
- Google Research, Geospatial Reasoning demonstration (October 2025): https://www.youtube.com/watch?v=kpeI9dbkWho
Share this story


